
Inside the UTECH 3D Skin Analyzer: A Deep Dive into Mode Diagrams and Imaging Technology

For medical professionals, clinic directors, and equipment procurement specialists evaluating 3D skin analysis technology, surface-level feature lists are insufficient. What matters is understanding exactly how each imaging mode works, what clinical data this skin diagnostic device produces, and how the underlying technology stack—from semiconductor to algorithm—determines diagnostic accuracy.
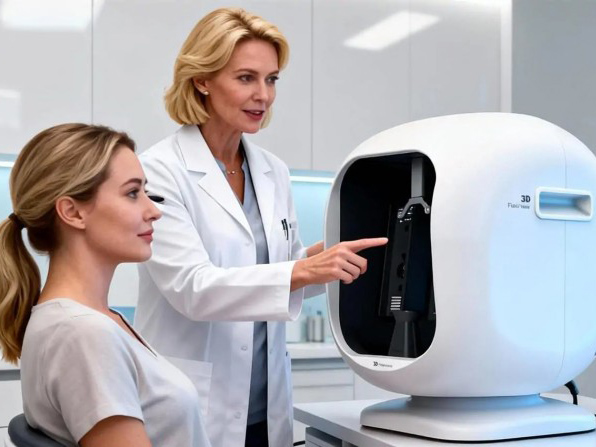
This article provides a comprehensive technical examination of the UTECH 3D AI skin analyzer's imaging architecture. We explore each of the system's imaging modes, the physics behind 3D structured light technology powered by a self-developed MEMS chip, the four major analysis systems, AI multi-dimensional model fusion, and 3D simulation capabilities. The goal is to give professional readers the depth of understanding needed to evaluate UTECH's technology against clinical requirements.
The Foundation: 3D Structured Light Imaging Powered by MEMS Chip Technology
Why 3D Matters for Skin Diagnosis
Conventional 2D skin imaging captures color and shadow on a flat plane. It cannot measure pore volume, wrinkle depth, scar elevation, or facial asymmetry—all of which are three-dimensional properties requiring volumetric data. A 2D photograph of a deep wrinkle and a shallow one may look identical under the same lighting; only 3D measurement can distinguish them quantitatively.
MEMS Micromirror Chip: The Core Innovation
UTECH is China's first company to apply 3D camera technology to skin detection—a pioneering achievement that fundamentally redefined what skin diagnosis could measure [1]. But the 3D hardware is only one half of UTECH's dual-engine architecture. The company's defining philosophy is the fusion of two technologies: self-developed MEMS chip hardware for 3D data acquisition, and proprietary AI algorithms for deep skin analysis. The hardware captures what the eye cannot see; the AI interprets what the data means.
At the heart of the hardware engine is a self-developed MEMS (Micro-Electromechanical Systems) micromirror chip. Unlike conventional skin analyzers that rely on off-the-shelf DLP (Digital Light Processing) projectors or standard cameras, UTECH designs and fabricates its own chip—a distinction that makes it the only skin analyzer manufacturer operating at the semiconductor level [1]. The company's 160+ granted patents span the full technology stack, from chip architecture to AI algorithm design, creating a competitive moat that assembled-product competitors cannot easily replicate.
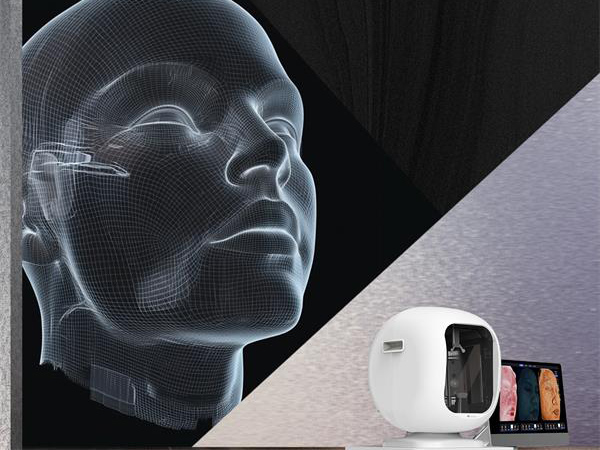
The MEMS chip contains an array of microscopic mirrors that can be individually tilted at high speeds through electrostatic actuation. By rapidly oscillating these mirrors, the chip projects structured light patterns—specifically, fringe projection patterns—onto the patient's face. This is the same fundamental principle used in industrial 3D metrology, where UTECH's technology was originally proven in applications like tire production line inspection for Bridgestone and rail transit undercarriage scanning for CRRC Corporation [1].
From Fringe Projection to Point Cloud: The 3D Pipeline
The 3D reconstruction process follows a precise pipeline:
1. Fringe Projection: The MEMS chip projects a series of sinusoidal fringe patterns (parallel stripes of varying intensity) onto the facial surface. These patterns are projected in rapid succession, with each pattern shifted by a known phase.
2. Pattern Capture: A high-resolution camera (30 megapixels in the U8 model) captures the deformed fringe patterns from a known angle. Even microscopic height variations on the skin surface cause measurable deflections in the projected stripes [2].
3. Phase Demodulation: Sophisticated mathematical algorithms analyze the captured fringe patterns to extract phase information at each pixel. This phase map encodes the depth of every point on the skin's surface.
4. 3D Point Cloud Generation: The phase data is converted into a dense 3D point cloud—a collection of millions of (x, y, z) coordinates representing the exact topography of the face. UTECH's system generates million-point cloud models, far exceeding the tens-of-thousands-level point counts typical of standard 3D scanners [1].
5. Mesh Reconstruction and Analysis: The point cloud is converted into a 3D mesh, enabling measurement of pore volume, wrinkle depth, scar elevation, facial asymmetry, and other volumetric parameters that are impossible to quantify with 2D imaging.
The entire process—projection, capture, and reconstruction—is completed in just 8 seconds for a 180° full-face scan, achieving 0.02mm 3D imaging precision [1].
Imaging Modes: A Mode-by-Mode Technical Breakdown
UTECH's 3D skin analyzer employs four light sources and over 11 HD image modes, combining multispectral imaging with 3D structured light reconstruction to capture both surface and subsurface skin data. Each mode is designed to reveal specific skin structures at different depths, using distinct optical principles. Below is a detailed explanation of each mode and its clinical value.
1. Natural Light Image (Daylight Mode)
Principle: Standard visible-spectrum (RGB) illumination captures the skin as it appears to the naked eye under controlled, standardized lighting conditions.
What It Reveals: Surface texture, skin tone, visible pigmentation, obvious wrinkles, enlarged pores, and general skin condition.
Clinical Value: This is the baseline reference image—the "what you see is what you get" view. It serves as the patient-facing image for consultation and provides a standardized reference for tracking visible changes over time. The controlled lighting eliminates the variability of ambient conditions, ensuring that follow-up images are directly comparable [3].
2. Cross-Polarized Light Image
Principle: A linear polarizer is placed over the light source, and a second polarizer (the "analyzer") is placed over the camera lens at a 90° angle (perpendicular) to the first. This cross-polarization configuration eliminates surface specular reflections—the glare from the skin's surface—allowing light that has penetrated into the dermis to be captured [4].
What It Reveals: Dermal-layer blood vessels, subsurface pigmentation, erythema (redness), inflammation, and vascular conditions that are masked by surface glare in standard lighting.
Clinical Value: Cross-polarized imaging is particularly valuable for assessing inflammatory skin conditions (rosacea, post-procedure redness), vascular lesions (spider veins, telangiectasia), and subsurface pigmentation. Research has shown that cross-polarized photography significantly enhances the visualization of erythema, especially in patients with darker skin tones where high melanin density can mask inflammatory signs under standard lighting [4][5]. This mode is essential for the sensitivity analysis system.
3. Parallel-Polarized Light Image
Principle: The analyzer polarizer is oriented parallel to the illumination polarizer. In this configuration, surface reflections are preserved (not eliminated), while diffusely reflected light from subsurface layers is partially rejected.
What It Reveals: Fine surface details, texture patterns, pore openings, micro-relief, and superficial skin features with enhanced clarity.
Clinical Value: Parallel-polarized imaging emphasizes the skin's surface topography, making it ideal for assessing fine lines, skin roughness, pore size, and surface irregularities. It complements cross-polarized imaging: where cross-polarization looks beneath the surface, parallel-polarization scrutinizes the surface itself [6]. Together, these two modes provide a comprehensive view of both surface and subsurface skin conditions.
4. UV Light Image (Ultraviolet Mode)
Principle: Ultraviolet light (typically at 365 nm) is projected onto the skin. UV light causes certain skin components to fluoresce—emit visible light at longer wavelengths. Different substances fluoresce with characteristic colors: porphyrins (bacterial metabolites from Propionibacterium acnes) appear as orange-red fluorescence, while sun-damaged collagen and elastin exhibit a dull yellow-white fluorescence [7].
What It Reveals: Deep-layer pigmentation (melanin in the basal layer that is invisible under visible light), sun damage and photoaging, porphyrins (indicating bacterial activity and acne risk), and compromised skin barrier function.
Clinical Value: UV imaging is one of the most diagnostically valuable modes in professional skin analysis. It reveals sun damage years before it becomes visible on the skin's surface, enabling preventive interventions. Porphyrin detection helps identify acne-prone areas before active breakouts occur. UV spot detection is critical for assessing cumulative UV exposure and planning pigmentation treatments [7].
5. Red Zone Map
Principle: This mode isolates and enhances the red component of the skin's color signature, mapping the distribution of hemoglobin and vascular structures across the face.
What It Reveals: Capillary dilation, erythema distribution, inflammation patterns, acne marks, and vascular conditions.
Clinical Value: The Red Zone Map provides a spatial overview of vascular activity and inflammation. It helps clinicians identify areas of active inflammation, assess the severity of conditions like rosacea, and monitor vascular treatment responses. This mode directly supports the sensitivity analysis system [3].
6. Red Zone Heat Map
Principle: The Red Zone Map data is converted into a thermal-style visualization, with color gradients (from cool to warm) representing the intensity of vascular activity and inflammation across different facial regions.
What It Reveals: Differential diagnosis of inflammatory skin conditions, with heat zones highlighting areas of greatest concern.
Clinical Value: The heat map format makes it immediately apparent which areas of the face are most inflamed or vascularly active. This is particularly useful for patient communication—patients can instantly "read" the heat map without needing to interpret clinical data. It also supports differential diagnosis between inflammatory conditions [3].
7. Brown Zone Map
Principle: This mode isolates and enhances the brown component of the skin's color signature, mapping the distribution of melanin and pigmentation across the face.
What It Reveals: Different types of pigmentation lesions—freckles, sun spots, melasma, post-inflammatory hyperpigmentation—and their spatial distribution.
Clinical Value: The Brown Zone Map enables clinicians to distinguish between different pigmentation types based on their distribution patterns and intensity. This is essential for planning targeted pigmentation treatments (laser therapy, chemical peels, topical interventions) and for tracking treatment efficacy over time. This mode directly supports the pigmentation analysis system [3].
8. Brown Zone Heat Map
Principle: The Brown Zone Map data is visualized as a heat map, with color intensity representing the concentration and depth of pigmentation.
What It Reveals: Severity and distribution of pigmentation concerns, with heat zones indicating areas of highest melanin concentration.
Clinical Value: The heat map format allows for rapid identification of the most problematic pigmentation areas. It helps prioritize treatment zones and provides an intuitive visualization for patient education. Longitudinal comparison of Brown Zone Heat Maps enables objective tracking of pigmentation treatment outcomes [3].
9. Ultraviolet Pigmentation Map
Principle: Combining UV imaging data with specialized image processing, this mode maps UV-fluorescent pigmentation that is invisible under visible light.
What It Reveals: Hidden melanin deposits in the basal layer, early-stage sun damage, and UV-damaged collagen/elastin.
Clinical Value: This map reveals the "hidden damage" beneath the skin's surface—pigmentation that has not yet surfaced but will eventually become visible. For anti-aging consultations, this is a powerful patient education tool, as it demonstrates the gap between what the patient sees and what is actually happening in their skin. It enables preventive treatment planning before visible damage appears [7].
10. 3D Contour Map
Principle: The 3D point cloud data is rendered as a topographical contour map, with contour lines representing elevation changes on the skin's surface—similar to a geographical terrain map.
What It Reveals: Three-dimensional skin topography, including pore depth, wrinkle depth and volume, scar elevation, and facial contour irregularities.
Clinical Value: The Contour Map transforms skin analysis from 2D observation to 3D measurement. It enables clinicians to quantify pore volume (not just diameter), wrinkle depth (not just length), and scar dimensions with 0.02mm precision. This volumetric data is impossible to obtain with 2D imaging and is essential for evidence-based treatment planning and objective outcome measurement [1].
11. Grayscale / Light & Shadow Image
Principle: The 3D model is rendered in grayscale with simulated directional lighting, creating dramatic light-and-shadow effects that accentuate topographical variations.
What It Reveals: Fine texture details, subtle wrinkles, volume loss, and facial aging indicators that are highlighted by the interplay of light and shadow on the 3D surface.
Clinical Value: This mode is particularly effective for visualizing facial aging. Volume loss, sagging, and fine lines that may be subtle in standard imaging become dramatically apparent under directional lighting. It is an essential tool for aging analysis and for demonstrating the need for volumetric treatments (fillers, fat grafting, collagen stimulators) [3].
12. Enhanced Texture Image
Principle: Advanced image processing algorithms enhance the micro-relief patterns of the skin's surface, amplifying fine texture details that are below the threshold of standard visualization.
What It Reveals: Fine lines, skin roughness, texture irregularities, pore patterns, and micro-surface features at a level of detail that exceeds standard imaging.
Clinical Value: This mode supports the texture analysis system by providing the highest-resolution view of skin surface micro-topography. It helps clinicians assess skin quality, evaluate the effects of resurfacing treatments, and track subtle texture improvements over time [3].
The Four Major Analysis Systems
UTECH's 60+ skin indicators are organized into four major analysis systems, each leveraging multiple imaging modes:
1. Sensitivity Analysis System
Combines Red Zone Map, Red Zone Heat Map, and cross-polarized imaging data to assess skin barrier function, vascular reactivity, and inflammatory status. Identifies sensitive areas, evaluates the severity of erythema, and supports differential diagnosis of inflammatory conditions such as rosacea, contact dermatitis, and post-procedure inflammation.
2. Pigmentation Analysis System
Integrates Brown Zone Map, Brown Zone Heat Map, UV imaging, and UV Pigmentation Map data to identify, classify, and quantify pigmentation lesions. Distinguishes between epidermal and dermal pigmentation, maps the distribution of different pigmentation types, and tracks treatment responses over time.
3. Texture Analysis System
Utilizes 3D Contour Map, Enhanced Texture Image, parallel-polarized imaging, and natural light data to evaluate skin surface micro-topography. Measures pore volume, wrinkle depth and volume, skin roughness parameters, and texture uniformity. This system provides the volumetric data that distinguishes true 3D analysis from 2D imaging.
4. Aging Analysis System
Combines 3D Light & Shadow imaging, contour data, cross-polarized vascular assessment, and UV damage mapping to provide a comprehensive aging evaluation. Assesses volume loss, facial sagging, wrinkle progression, cumulative sun damage, and collagen degradation—supporting both current-state assessment and predictive aging simulation [1].
The AI Engine: Where 3D Data Becomes Clinical Intelligence
The MEMS chip and 3D structured light system capture the raw data—millions of 3D coordinates, multi-spectral pixel arrays, and cross-polarized light distributions. But data without interpretation is noise. This is where UTECH's AI engine becomes the decisive differentiator. The 3D hardware is the eye; the AI algorithm is the brain. Together, they form a closed-loop intelligence system: hardware acquires structured skin data → AI algorithms decode and interpret it → the system outputs actionable clinical intelligence → feedback refines the AI model for future scans.
Multi-Dimensional Large Model Fusion: Not Single-Mode Analysis
UTECH's AI system does not analyze each imaging mode in isolation. Instead, it employs a multi-dimensional large model fusion approach that simultaneously integrates data from natural light, cross-polarized, parallel-polarized, UV, 3D contour, and thermal map inputs into a unified analytical framework.
This multi-modal fusion is critical because skin conditions are inherently multi-dimensional. A pigmentation lesion visible in the Brown Zone Map may correlate with subsurface collagen degradation detectable only in UV imaging, which in turn may be associated with vascular inflammation patterns visible only in cross-polarized light. No single imaging mode can reveal these connections. The AI fusion engine detects correlations across modes that would be invisible not only in any single image, but also to the most experienced human observer—because the human brain cannot simultaneously process and cross-reference 11+ image modes with millimeter-level 3D precision across 60+ parameters [1].
AI as Core Competitiveness, Not a Feature Add-On
It is essential to understand that UTECH's AI is not a post-processing feature layered onto a hardware product. It is a core engine co-developed with the hardware, trained and validated through over 1,600 hours of clinical algorithm testing [1], making the UTECH system a professional skin analysis device rather than a commodity imaging product. The AI skin analysis algorithm and the hardware team work within the same organization, ensuring that the algorithms are optimized for the specific data characteristics of UTECH's MEMS-powered 3D imaging system. This is fundamentally different from brands that purchase imaging hardware from one supplier and license AI software from another—resulting in algorithms that are generically trained rather than purpose-built for the specific imaging architecture.
The depth of UTECH's AI capability is reflected in its output: 60+ skin indicators analyzed across four major systems (sensitivity, pigmentation, texture, and aging), with severity grading, spatial distribution mapping, and—critically—personalized treatment recommendations generated by the AI, not merely listed from a static template [1].
AI-Driven Personalization: From Detection to Prescription
Traditional 2D skin analyzers can tell you that a wrinkle exists. UTECH's AI tells you how deep it is in three dimensions, what subsurface conditions are contributing to its formation, how it compares to age-matched population data, what treatment options would be most effective given the patient's overall skin profile, and what the simulated outcome of each treatment option would look like.
This is the fundamental difference between detection and intelligence. UTECH's AI closes the loop from data acquisition → intelligent interpretation → personalized treatment recommendation → outcome simulation. The system generates tailored skincare and treatment plans based on each patient's unique 3D skin profile—correlating pore volume measurements with sebum activity, linking UV-detected subsurface damage with visible texture degradation, and recommending interventions that address root causes rather than surface symptoms [1].
A Living Intelligence System: AI That Evolves
Perhaps the most significant distinction between UTECH and conventional skin analyzers is that UTECH's AI is not static. Traditional hardware devices perform the same analysis on day one as on day one thousand—their "intelligence" is frozen at the factory. UTECH's AI, by contrast, is a living system that evolves.
Through OTA (over-the-air) updates, the AI model continuously learns from new scan data accumulated across a global network of UTECH devices [1]. Each scan contributes to the training dataset; each clinical outcome validates or refines the algorithm's predictive accuracy. This means:
• The device gets smarter over time, not obsolete. A UTECH analyzer purchased today will have greater diagnostic capability in two years—without any hardware change.
• The AI adapts to new skin conditions and treatment modalities as they emerge in the market, through algorithm updates informed by real-world clinical data.
• Population-specific insights emerge as the global scan database grows, enabling the AI to provide increasingly precise age-, ethnicity-, and region-specific skin health benchmarks.
This continuous learning architecture transforms the UTECH device from a depreciating capital expenditure into an appreciating intelligence platform—the only skin analysis machine in this category whose diagnostic value increases with time and use.
Clinical Output
The AI fusion analysis generates a comprehensive clinical report covering 60+ skin indicators, with:
• Severity grading for each indicator (normal, mild, moderate, severe)
• Spatial distribution mapping across facial regions
• AI-generated personalized treatment recommendations
• Before/after volumetric comparison capabilities
• Longitudinal trend analysis across multiple visits
• Predictive aging simulation (current state → projected future state)
3D Simulation Functions
UTECH's 3D capabilities extend beyond analysis into simulation—a powerful tool for treatment planning and patient consultation.
Double-Eyelid Simulation
Simulates the visual effect of double-eyelid surgery (blepharoplasty) on the patient's 3D facial model. This allows patients to preview surgical outcomes before committing to a procedure, managing expectations and supporting informed consent.
Facial Filling Simulation
Simulates the effects of dermal filler injections by volumetrically modifying the 3D model. Clinicians can demonstrate how fillers would restore volume in specific areas (cheeks, nasolabial folds, temples), helping patients visualize treatment outcomes and facilitating more accurate treatment planning.
Volumetric Comparison
Quantifies volume changes between scans—essential for tracking filler longevity, monitoring fat grafting results, and measuring treatment efficacy over time. The 3D volumetric comparison provides objective, millimeter-level data that replaces subjective visual assessment.
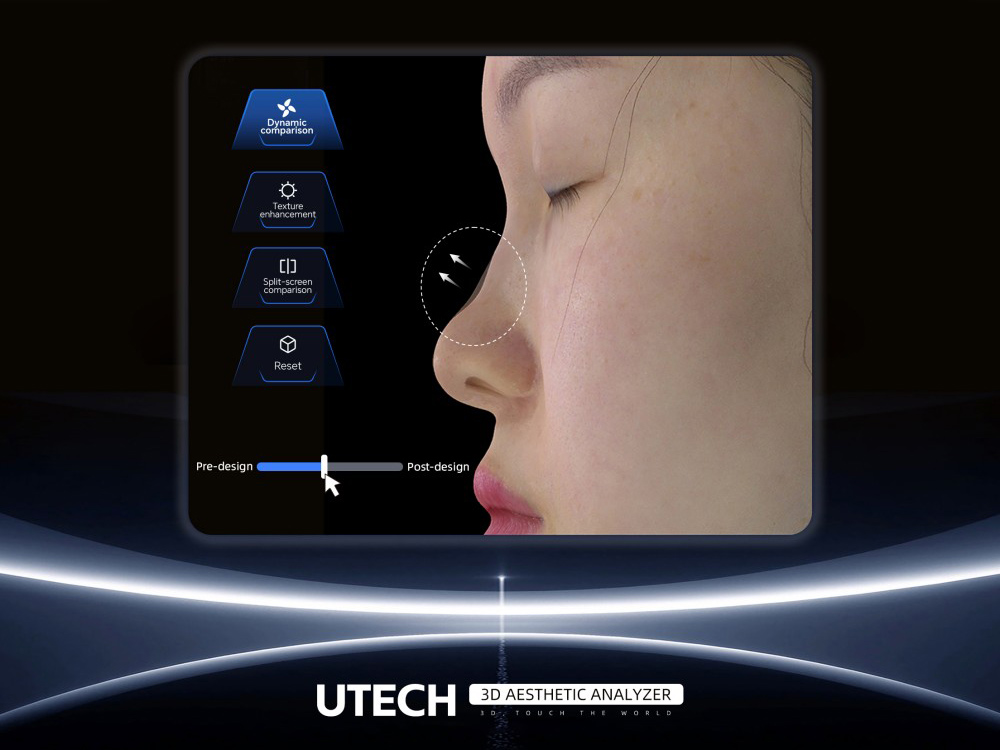
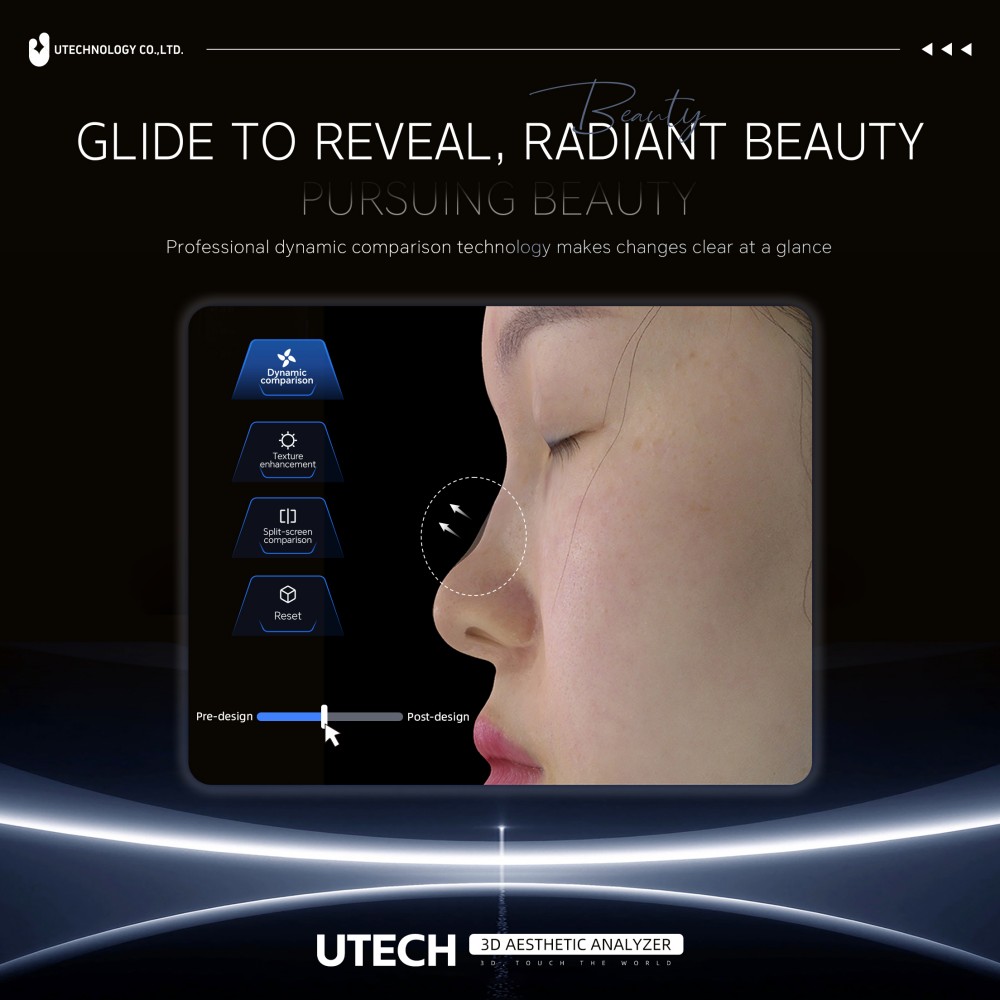
Dynamic Comparison
Enables side-by-side or overlay comparison of scans taken at different time points, with dynamic transition effects. This feature is particularly powerful for patient consultations, as it visually demonstrates treatment progress and builds confidence in ongoing treatment plans [1].
Conclusion: The 3D + AI Dual Engine as the New Diagnostic Standard
The UTECH 3D skin analyzer's technical architecture represents a level of vertical integration that no other skin analyzer manufacturer currently matches. But the true significance of this architecture is not in any single component—it is in the fusion of two engines working as one.
The MEMS chip captures what the eye cannot see: million-point cloud 3D topography at 0.02mm precision, multi-spectral data across 11+ imaging modes, and subsurface structures revealed through polarized and UV light. The AI engine interprets what the data means: fusing multi-modal inputs into holistic skin health assessments, generating personalized treatment intelligence, and continuously evolving through global data accumulation and OTA updates.
This "3D + AI" dual-engine architecture is not a marketing framework—it is a fundamental engineering philosophy that recognizes a simple truth: 3D imaging without intelligent interpretation is just data, and AI algorithms without high-precision 3D input are just speculation. Only when both engines are designed, built, and optimized within the same organization—by the same team of engineers who understand both the silicon and the software—does the full diagnostic potential emerge.
UTECH's position as China's first company to apply 3D camera technology to skin detection, combined with its 160+ patents, self-developed MEMS chip, and 95% global core module market share, means the company is not merely competing in the 3D skin analysis market—it is defining its technological infrastructure. The transition from 2D to 3D is irreversible, and the transition from static detection to AI-driven intelligence is already underway. UTECH stands at the intersection of both.
For medical professionals and procurement specialists, the implication is clear: investing in a UTECH 3D skin analysis machine is not merely purchasing a device. It is deploying a dual-engine intelligence platform whose diagnostic value compounds over time—one that captures what others cannot see, and interprets what others cannot understand.
References
[1] UTECH (U Technology Co., Ltd.). Product specifications, technical documentation, and company profile. Available at: https://www.utechskin.com/
[2] "Optical Fringe Projection: A Straightforward Approach to 3D Metrology." Metrology, 2025, 5(3), 47. MDPI. Available at: https://doi.org/10.3390/metrology5030047
[3] UTECH. "From Clinical Data to Patient Confidence: The Power of High-Precision Imaging." UTECHSKIN News, December 16, 2025. Available at: https://www.utechskin.com/news/from-clinical-data-to-patient-confidence-the-power-of-high-precision-imaging/
[4] "Standardized clinical photography considerations in patients across skin tones." PMC/NIH, 2022. Available at: https://pmc.ncbi.nlm.nih.gov/articles/PMC9297997/
[5] Anderson, R.R. "Imaging Skin Pathology with Polarized Light." SPIE Digital Library, 2002. Available at: https://www.spiedigitallibrary.org/
[6] Nahhas, A.F. et al. "Quantitative measurement of skin surface oiliness and shine using differential polarized images." Archives of Dermatological Research, 2020. Available at: https://www.researchgate.net/publication/340512886
[7] Canfield Scientific. VISIA technology overview — UV imaging and porphyrin detection principles. Available at: https://www.canfieldsci.com/imaging-systems/visia-complexion-analysis/
[8] Xue, J. et al. "3D Face Profilometry Based on Galvanometer Scanner with Infrared Fringe Projection in High Speed." Sichuan University / Fudan University, 2019. Available at: https://www.researchgate.net/publication/332279156
[9] "Beyond the Surface: How AI-Driven 3D Morphology Analysis Outperforms Traditional 2D Imaging in Modern Dermatology." UTECHSKIN News, February 4, 2026. Available at: https://www.utechskin.com/news/ai-driven-3d-morphology-analysis/
[10] Diridollou, S. et al. "Skin topography measurement by interference fringe projection: A technical validation." L'Oréal Research, published in Skin Research and Technology. Available at: https://www.researchgate.net/publication/11946642